Cluster Monitoring
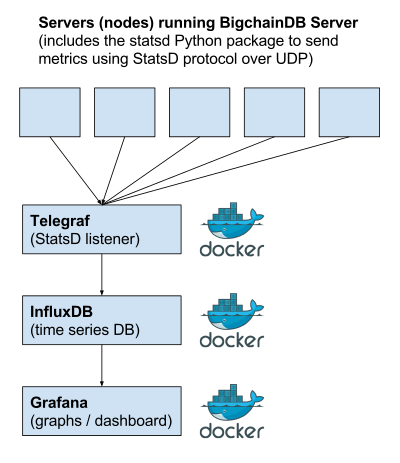
BigchainDB uses StatsD for cluster monitoring. We require some additional infrastructure to take full advantage of its functionality:
- an agent to listen for metrics: Telegraf,
- a time-series database: InfluxDB, and
- a frontend to display analytics: Grafana.
We put each of those inside its own Docker container. The whole system is illustrated below.
For ease of use, we’ve created a Docker Compose file (named docker-compose-monitor.yml) to define the monitoring system setup. To use it, just go to to the top bigchaindb directory and run:
$ docker-compose -f docker-compose-monitor.yml build
$ docker-compose -f docker-compose-monitor.yml up
It is also possible to mount a host directory as a data volume for InfluxDB
by setting the INFLUXDB_DATA environment variable:
$ INFLUXDB_DATA=/data docker-compose -f docker-compose-monitor.yml up
You can view the Grafana dashboard in your web browser at:
http://localhost:3000/dashboard/script/bigchaindb_dashboard.js
(You may want to replace localhost with another hostname in that URL, e.g. the hostname of a remote monitoring server.)
The login and password are admin by default. If BigchainDB is running and processing transactions, you should see analytics—if not, start BigchainDB and load some test transactions:
$ bigchaindb load
then refresh the page after a few seconds.
If you’re not interested in monitoring, don’t worry: BigchainDB will function just fine without any monitoring setup.
Feel free to modify the custom Grafana dashboard to your liking!